
Introduction
After installing and configuring mail server, the process of monitoring Postfix activity by Zabbix becomes essential to ensure stability and early threat detection.

Defining the monitoring type
First, it is essential to determine what exactly needs to be monitored, what state is considered normal, and what indicates a deviation. I am interested in two metrics: mail queue statistics and monitoring the number of processes, which we will discuss in detail.
This monitoring setup complements my previous guides on configuring email forwarding in Postfix and configuring PostfixAdmin to manage mailboxes.
Mail queue statistics
When the mail server operates correctly, emails are usually processed instantly, and the queue does not form, or it is only a momentary process. However, if the server becomes unavailable, the queue accumulates, which indicates a problem with the mail server. Under normal operation, this value is zero; if it is greater than zero, attention should be paid to it.
Monitoring the number of processes
Under normal idle operation, the server typically runs 5 processes:
- master – the main Postfix process (manages all other processes).
- qmgr – manages the mail queue, responsible for delivering messages.
- tlsmgr – manages TLS sessions for encryption (if used).
- pickup – processes new messages entering the queue.
- showq – displays the status of the mail queue.
During authentication, sending, or receiving mail, the number of processes increases to 9 or 10. Thus, if authentication occurs, even a failed one, it is recorded, allowing the administrator to take action against potential attacks on the server.
Zabbix is a powerful tool for hardware and service health. You can also explore configuring email notifications in Zabbix for a complete overview.
Connecting Postfix to Zabbix
Since Zabbix Agent is already installed on the server, the configuration is straightforward via the configuration file. To do this, the Zabbix Agent configuration file must be updated with user parameters for our metrics.
Open the configuration file, usually located at:
sudo nano /etc/zabbix/zabbix_agentd.confAdd the following lines at the end of the file:
# Settings for Postfix:
UserParameter=postfix.queue_size,postqueue -p | tail -n 1 | awk '{print ($5+0)}'
UserParameter=postfix.active_processes,ps aux | grep "[p]ostfix" | wc -l
Restart the Zabbix agent:
sudo systemctl restart zabbix-agentCreating Items in Zabbix
In the Data Collection menu, select the Hosts submenu and, in the host list, click on Items. Then, in the Items list window, click the Create item button.
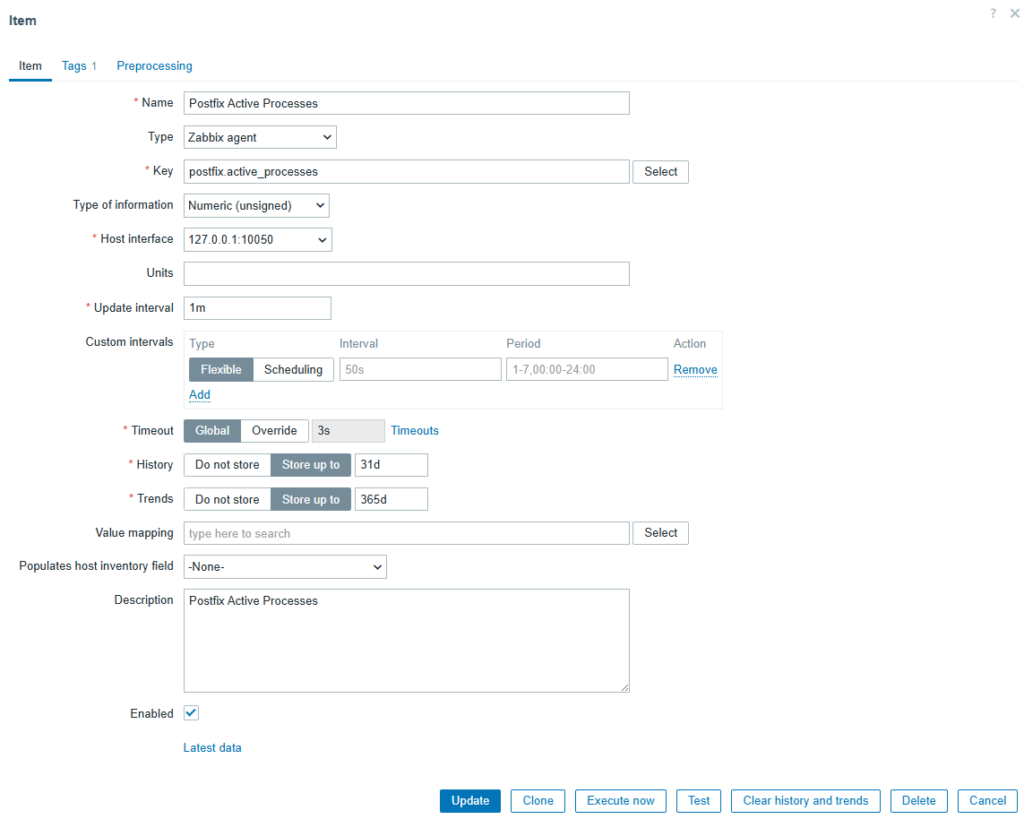
To monitor active Postfix processes (postfix.active_processes) fill form by next data:
- Name: Postfix Active Processes
- Type: Zabbix Agent
- Key: postfix.active_processes
- Type of Information: Numeric (unsigned)
- Host interface: 127.0.0.1:10050
- Update interval: 1m
- Description: Postfix Active Processes
- Enabled: checkbox
In the Tags tab:
- Name: Mail
- Value: Postfix
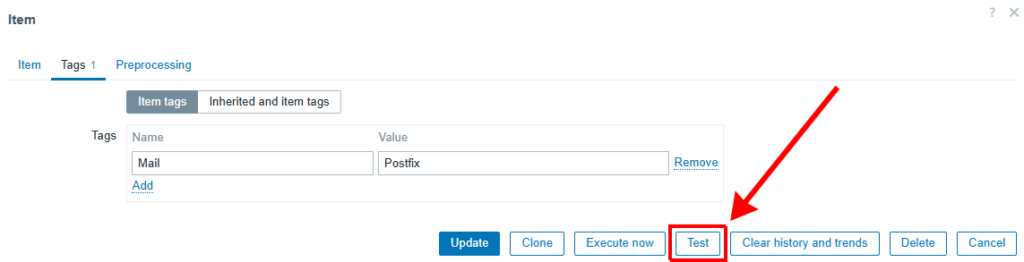
To ensure the item works correctly, test its functionality and obtain the expected value by clicking TEST and GET VALUE.
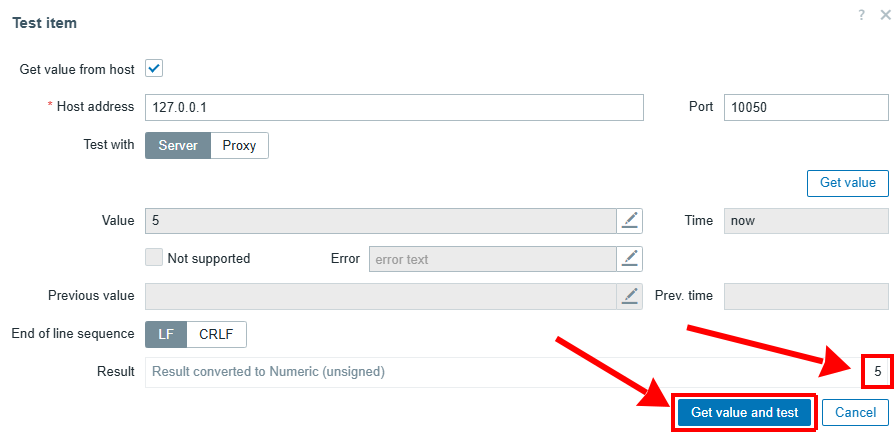
Similarly, create a second item to monitor the mail queue (postfix.queue_size), with the only difference being the Key: postfix.queue_size. Again, test the created item to obtain the expected result – 0.
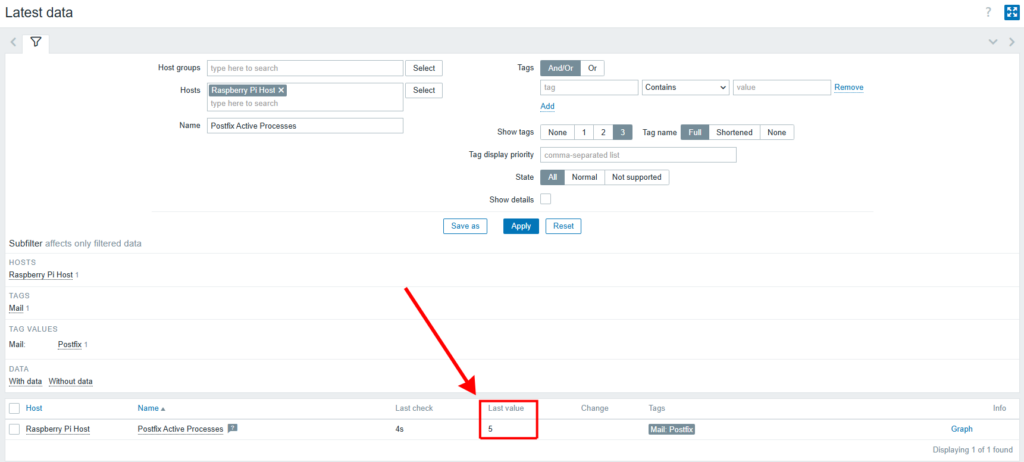
Verifying data collection
After one minute, Postfix begins collecting data. To view it, navigate to the Monitoring menu and select Latest data. In the name filter, enter Postfix Active Processes. On the Latest data page, the Last check column should display the expected value, which in my case is 5.
Creating a dashboard graph
To display the graph on the dashboard, click the Add button, which will automatically open the new widget creation window. Fill in the following fields:
- Type: Graph
- Name: Mail
- Refresh interval: Default 1m
- Data set: select the host and items
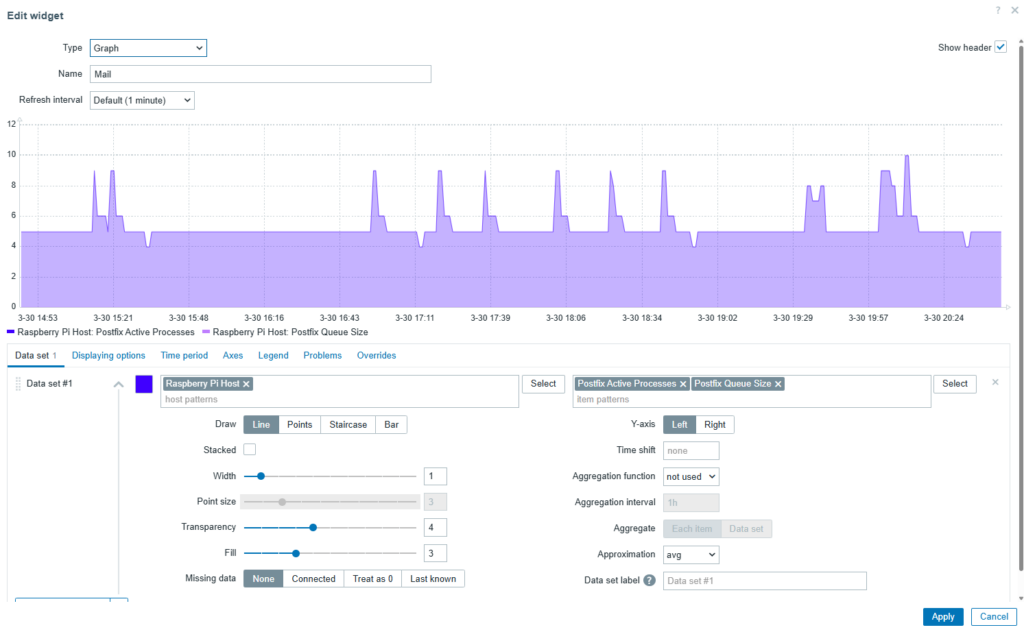
Other characteristics in the Data set tab, such as color and transparency, can be customized as desired.
Detecting and mitigating a server attack
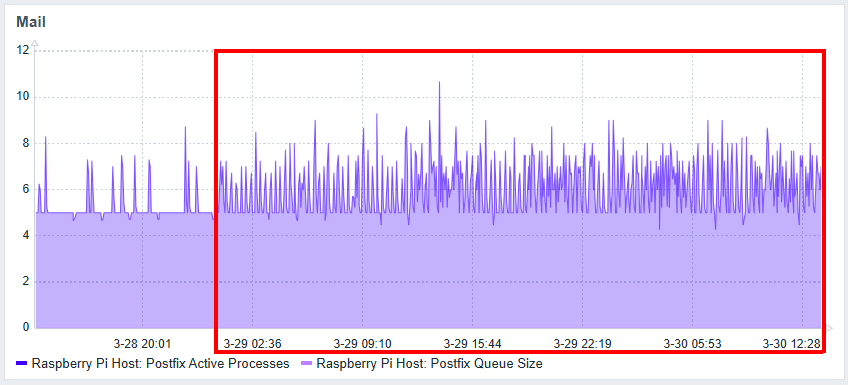
I regularly monitor the mail server’s activity and noticed significantly high activity on the dashboard graph. By expanding the date range to two days, I identified the exact date and time when the attack began.
Reviewing Postfix logs for the past two days, I discovered that a malicious actor was attempting brute-force login authentication on my mail server. Although these attempts failed, they still consumed server resources:
sudo tail -f /var/log/mail.logMar 30 13:31:51 mail postfix/smtpd[1230298]: connect from unknown[196.251.92.50]
Mar 30 13:31:55 mail postfix/smtpd[1230298]: warning: unknown[196.251.92.50]: SASL LOGIN authentication failed: (reason unavailable), sasl_username=admin2
Mar 30 13:31:55 mail postfix/smtpd[1230298]: disconnect from unknown[196.251.92.50] ehlo=1 auth=0/1 quit=1 commands=2/3
Mar 30 13:35:13 mail postfix/smtpd[1230766]: connect from unknown[196.251.92.50]
Mar 30 13:35:17 mail postfix/smtpd[1230766]: warning: unknown[196.251.92.50]: SASL LOGIN authentication failed: (reason unavailable), sasl_username=back-up
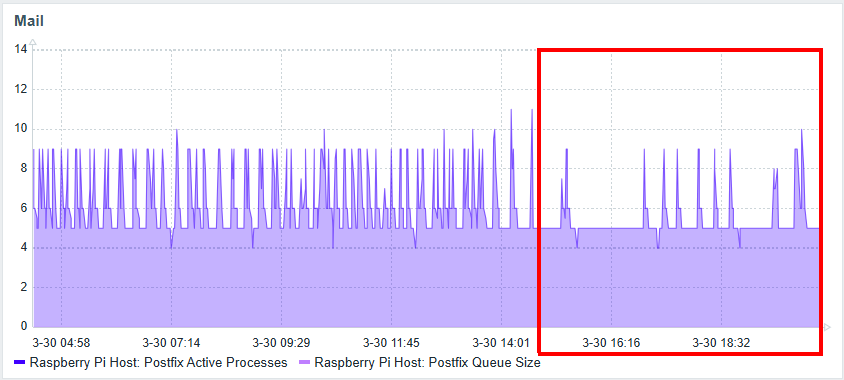
Mar 30 13:35:17 mail postfix/smtpd[1230766]: disconnect from unknown[196.251.92.50] ehlo=1 auth=0/1 rset=1 quit=1 commands=3/4 To mitigate this incident, I blocked the specified address in the router’s firewall settings and applied the rule. After that, the server activity returned to normal.
Conclusions
Monitoring Postfix activity with Zabbix enables timely detection of mail server issues, such as mail queue accumulation or suspicious activity. By configuring metrics to track the queue size and the number of active processes, administrators can quickly respond to potential threats and system failures.
During server operation, monitoring also helps identify unauthorized access attempts, such as brute-force login attacks. By analyzing graphs and system logs, administrators can take immediate security measures, such as blocking malicious IP addresses. This significantly enhances the security of the mail infrastructure and ensures stable service operation.