
Introduction
Raspberry Pi temperature monitoring with Zabbix is essential for maintaining the health of my home server or IoT setup. In this guide, I’ll show you how to fetch CPU metrics, fix common permission errors, and create real-time alerts to prevent overheating.
Since I have Zabbix installed directly on the Raspberry Pi, it acts as both the server and agent, making setup slightly easier.
Fixing Permissions for Zabbix Agent
To avoid errors while collecting temperature data, you may need to perform some permission tweaks, especially if you run into this error:
Try creating a device file with: sudo mknod /dev/vcio c 100 0In my case, /dev/vcio already existed but lacked proper permissions. I need to fix it.
Permission settings
sudo chgrp video /dev/vcio
sudo chmod 660 /dev/vcio
Then, add the zabbix user to the video group
sudo usermod -aG video zabbixand restart the agent to apply changes
sudo systemctl restart zabbix-agentNow you can go to user settings
Creating a Custom User Parameter
To let Zabbix agent fetch the CPU temperature, we add a custom user parameter to the config file
sudo nano /etc/zabbix/zabbix_agentd.confAdd this line to the end of the file:
UserParameter=system.cpu.temp,vcgencmd measure_temp | sed -n "s/temp=\([0-9]*\.[0-9]*\)[^0-9]*$/\1/p"Breakdown:
UserParameterdefines a custom key.system.cpu.tempis the key name.vcgencmd measure_tempis a standard Raspberry Pi command returning temp liketemp=45.0'C.- The
sedcommand extracts just the numeric part (e.g.,63.3).
Restart the agent again:
sudo systemctl restart zabbix-agentAdding a New Item in Zabbix Web Interface
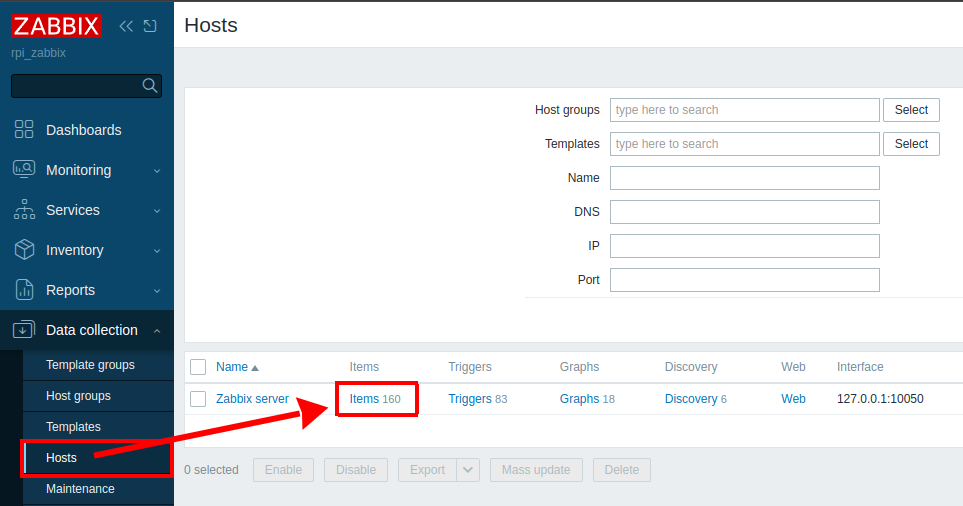
Go to: Data collection → Hosts → Zabbix server → Items → Create item
Fill in the fields:
- Name: CPU Temperature
- Type: Zabbix agent
- Key: system.cpu.temp
- Type of information: Numeric (float)
- Units: °C
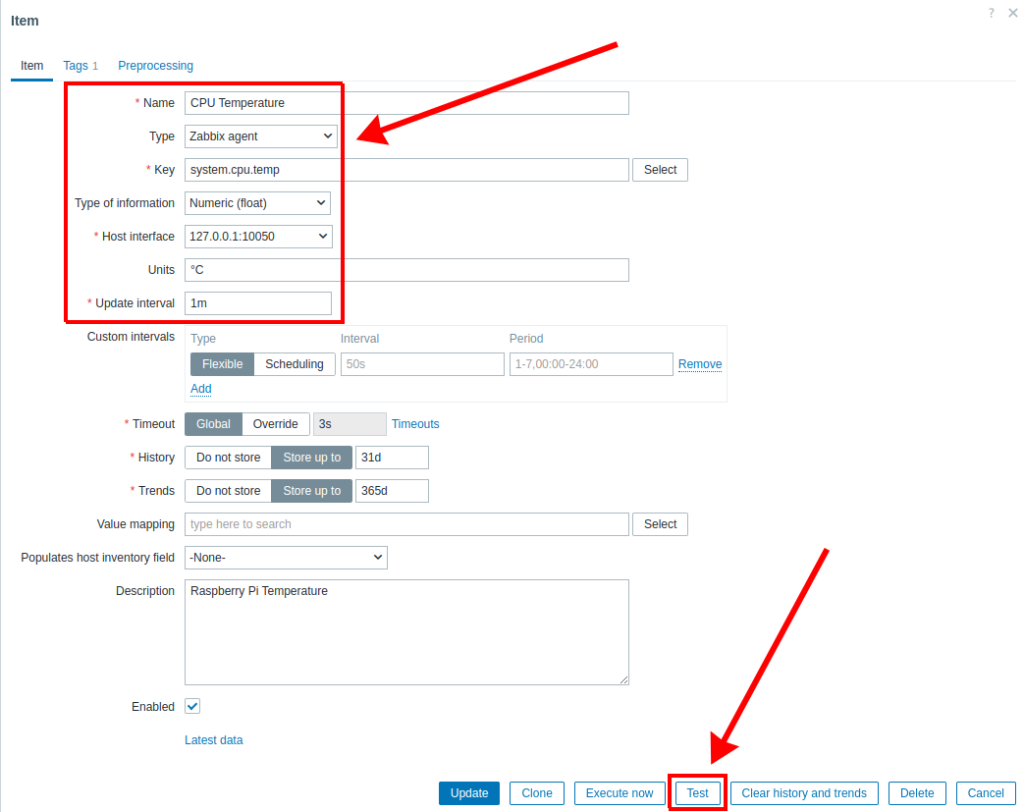
Test the item by clicking Test → Get value and test.
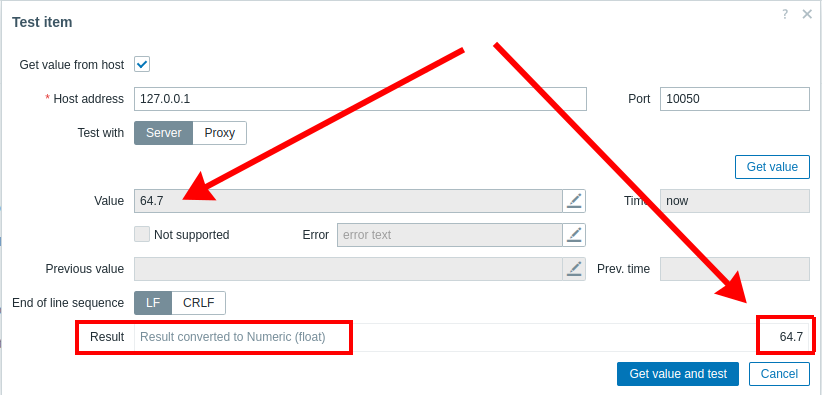
We got the correct result, which indicates the correct settings. We save this item. Сlick Add or Update
Creating a Trigger for Alerts
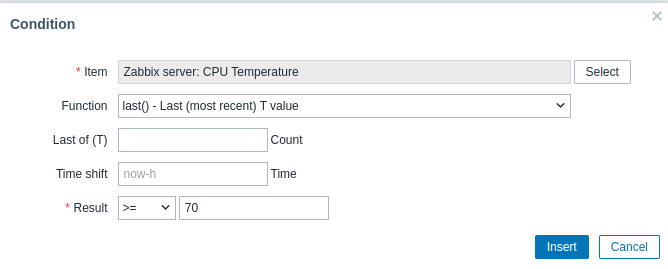
In order for me to receive notifications about the temperature rising, for example to the desired value of 70 degrees, I need to create a trigger. It will compare the current temperature with the critical one, and if such an event occurs, a notification will appear on the dashboard.
If you notice the temperature spikes too often, you might need to adjust your cooling setup; check my guide on how to fix fan speed on Waveshare PoE HAT+.
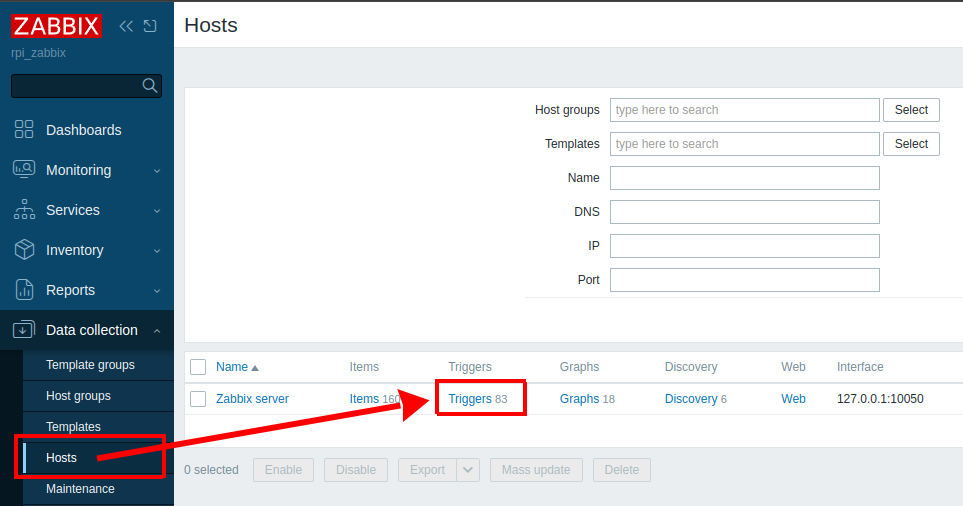
Navigate to: Data collection → Hosts → Zabbix server → Triggers → Create trigger
Fill in:
- Name: CPU Temperature is too high
- Event name: CPU Temperature is too high
- Severity: Warning
- Expression:
last(/Zabbix server/system.cpu.temp)>=70
You can also use the expression constructor
Click Add to save.
Adding a Graph Widget to the Dashboard
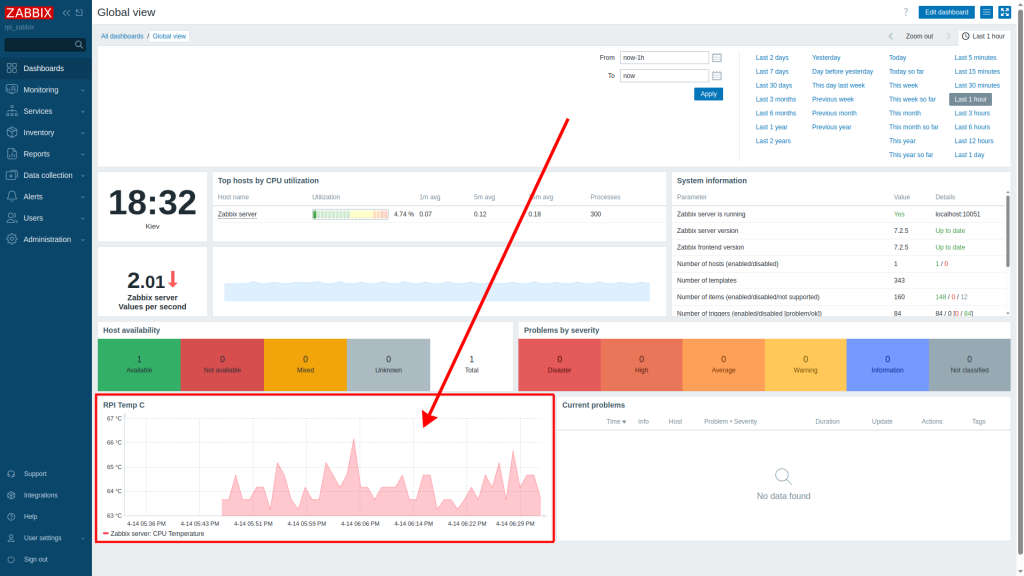
It would be visually appealing to observe the device’s temperature graph depending on the conditions of use.
Once your monitoring is live, make sure your dashboard looks professional by setting the Zabbix 24-Hour Time Format for your new graphs.
To visualize temperature data, go to your Zabbix dashboard, click Edit dashboard, and add a new widget.
Configure the widget as:
- Type: Graph
- Name: RPI Temp C
- Host patterns: Zabbix Server
- Item patterns: CPU Temperature
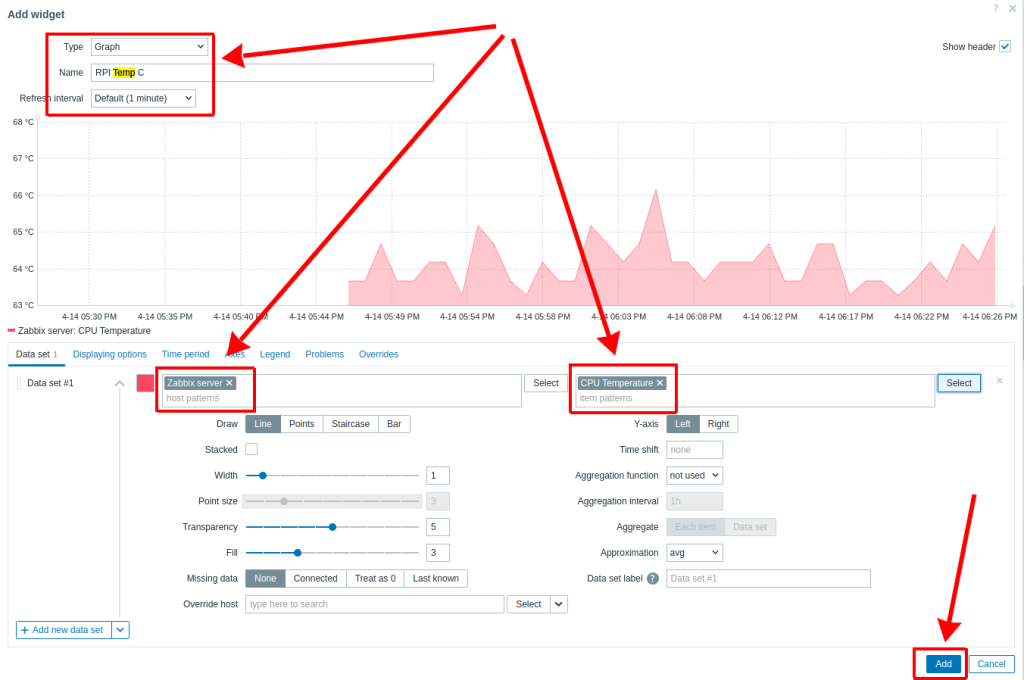
Click Add, then resize or reposition the widget as you like.
Add this widget by clicking the Add button. You can then resize and position this widget as you see fit. After that, confirm saving the dashboard by clicking the Save changes button in the upper right corner.
Conclusion
As you can see, Zabbix Raspberry Pi temperature monitoring is quite achievable. Once configured, you’ll have a reliable tool that can alert you when your Pi overheats and display historical temperature trends in a clean graphical format. Whether you’re running a home server or experimenting with projects, CPU temperature monitoring on Raspberry Pi is a smart precaution.