
Introduction
Setting up the Zabbix 24-hour time format is a common task for administrators who find the default US 12-hour (AM/PM) display inconvenient. By default, Zabbix follows the system’s locale, but we can easily change this to a 24-hour format by switching to the British English locale. This article explains how to properly configure the server to use the en_GB.UTF-8 locale and ensure that time is shown correctly on Zabbix graphs.
Checking Current Settings
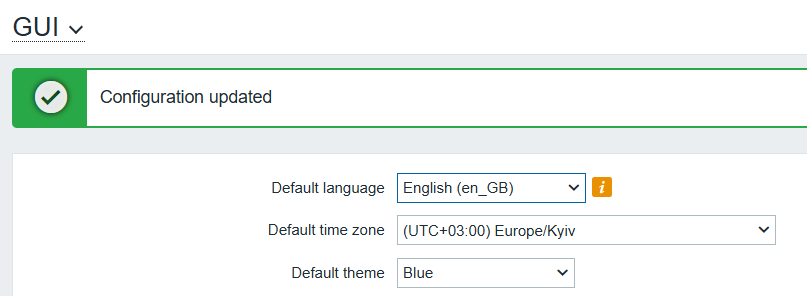
To check the current GUI language settings, go to Administration → General, then open the GUI tab. The current interface language will be shown in the Default language field. If locales are not installed on the server, you may see the message: You are not able to choose some of the languages, because locales for them are not installed on the web server.
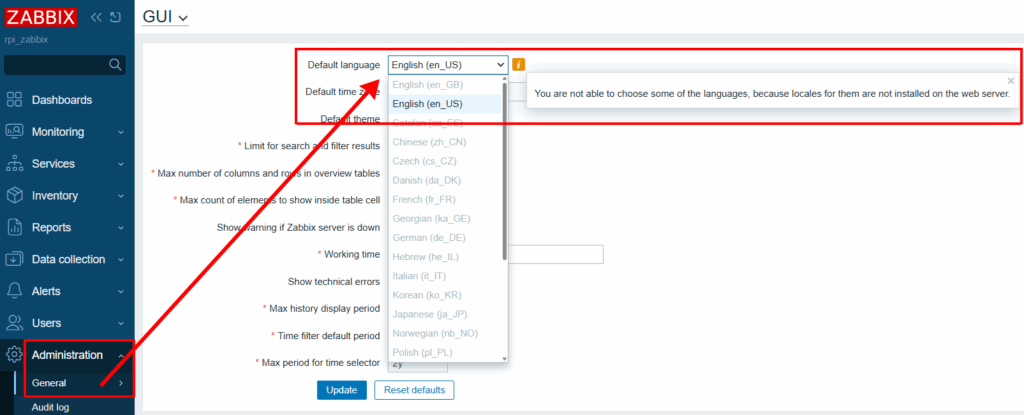
This indicates that you need to configure locales on the server.
Once your time format is corrected, you can focus on more advanced tasks, such as monitoring Raspberry Pi CPU temperature with Zabbix to keep an eye on your hardware health.
Locale Configuration
To view the installed locales on your Linux system, run:
locale -aExample output:
C
C.utf8
en_US.utf8
POSIX
As we can see, only the US locale is currently available. To install additional locales, run:
sudo dpkg-reconfigure localesA graphical interface will open. Use the keyboard to select en_GB.UTF-8 by navigating with the arrow keys and pressing space to mark the selection. Then press Tab to choose OK and hit Enter.
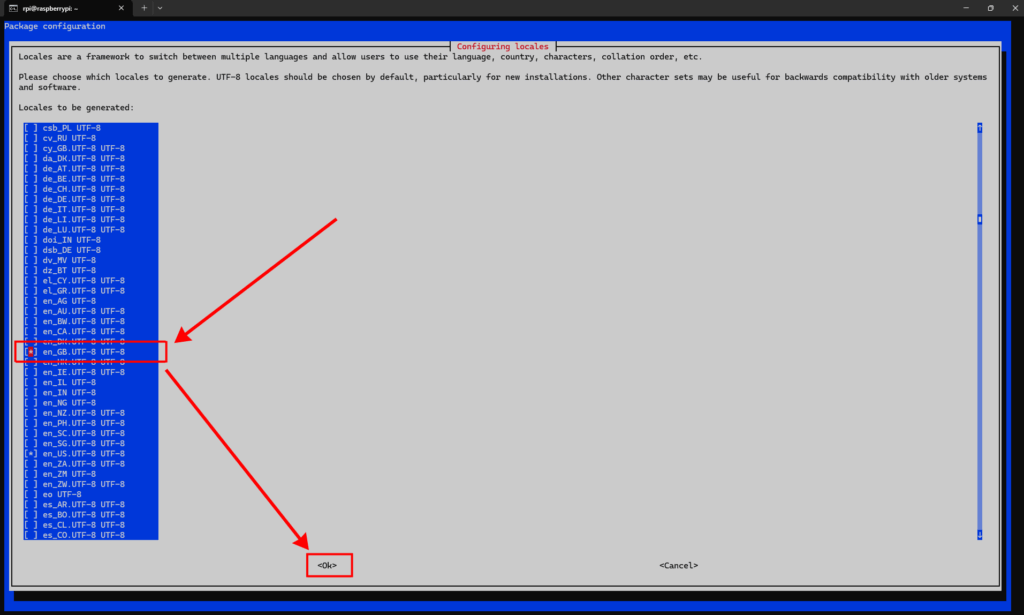
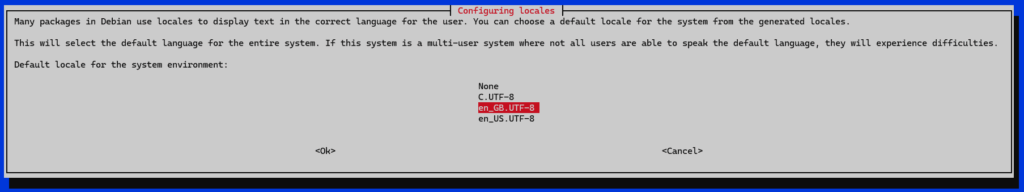
Next, you’ll be asked to choose the default locale. Select en_GB.UTF-8 again and confirm.
Console output:
Generating locales (this might take a while)...
  en_GB.UTF-8... done
  en_US.UTF-8... done
Generation complete.
Restart Apache:
sudo systemctl restart apache2Even though the new locale is now available and the web server is restarted, the time format on graphs still won’t change unless we update the locale environment variables system-wide.
Edit the file:
sudo nano /etc/default/localeEnsure it contains:
LANG=en_GB.UTF-8
LC_ALL=en_GB.UTF-8
LANGUAGE=en_GB.UTF-8
Then reboot the server (in my case, a Raspberry Pi):
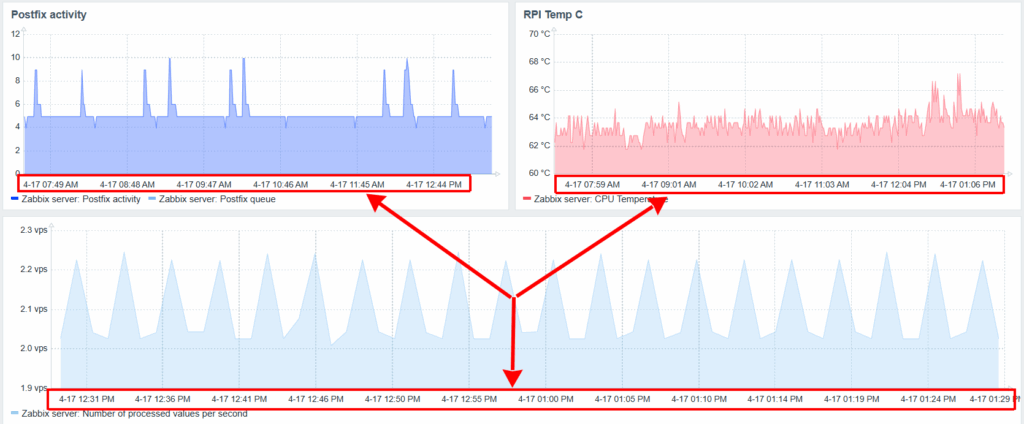
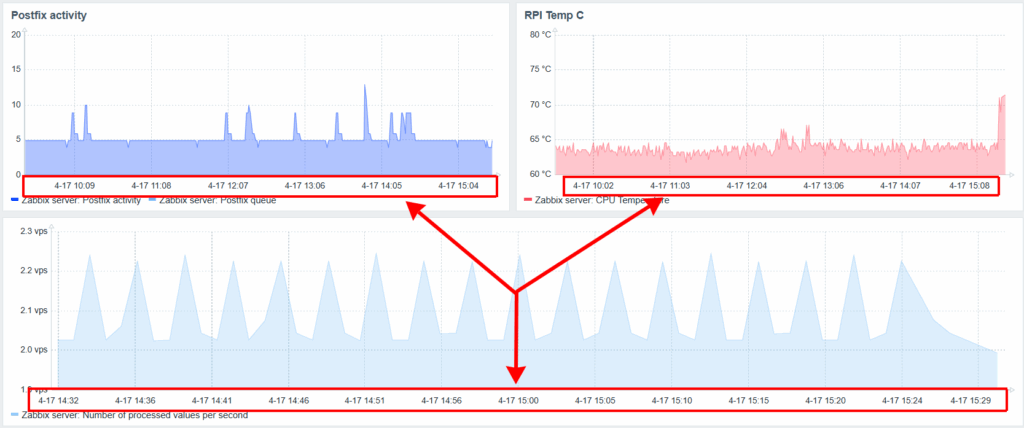
sudo rebootAfter rebooting, Zabbix will begin displaying time in the 24-hour format on graphs.
Conclusion
System locale settings significantly impact the usability and clarity of monitoring dashboards like Zabbix. As shown, simply changing the language in the GUI is not enough – you must also properly configure the server locale and restart the system. With the correct settings in place, the time on graphs will now follow the 24-hour format, making the interface more familiar and easier to interpret for users in many parts of the world.
- For even more control over your environment, you might also be interested in monitoring Docker container activity in Zabbix.
- If you want to keep your monitoring dashboard secure while working on these settings, check out my guide on how to setup Zabbix local network access only.