Monitoring Docker containers in Zabbix is the perfect way to keep your home server under control. While docker stats is okay for a quick look, Zabbix provides deep historical analysis and professional visualization for every service running on your Raspberry Pi 5.
Introduction
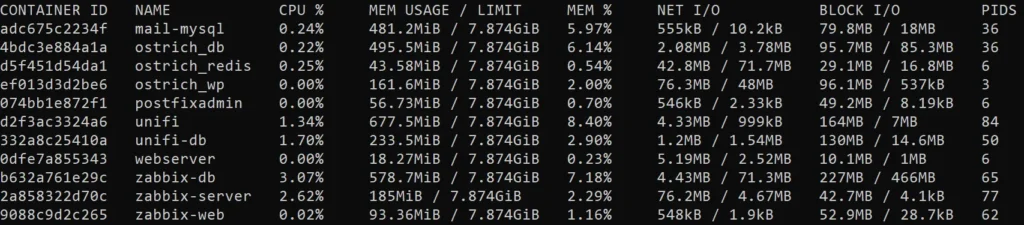
Of course, you can simply go to the console and type docker stats. It will display basic information about resource usage. However, the docker stats utility looks rather dull.
For better visual perception and history analysis, I chose Zabbix. It allows me not only to see the current state but also to build graphs, compare the activity of different services, and store the history of metrics over a long period.
Here is a rough diagram of how my Zabbix Server interacts with the agent on the Raspberry Pi and retrieves data from the Docker Engine.
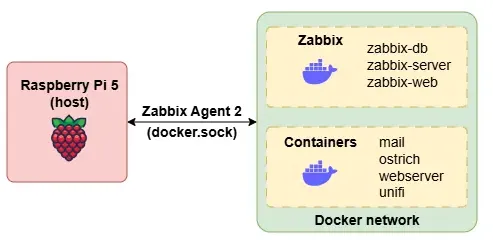
In this architecture, the Raspberry Pi acts as the physical host where Docker is running and all services are launched as containers, including the Zabbix Server, the database, the Zabbix web interface, and other application containers.
The host itself has Zabbix Agent 2 installed, which has access to the Docker API via the docker.sock socket. Thanks to this, the agent receives information about the status of containers, their status, CPU, memory, network, and disk usage without direct connection to each individual container.
Zabbix Agent 2 transmits the collected metrics to the Zabbix Server running in a Docker container, where this data is processed, stored in the database, and used for triggers and alerts.
The user interacts with the system through the Zabbix web interface, which runs in a container and is accessible via HTTP/HTTPS, providing up-to-date information on the status of both the Raspberry Pi host and all Docker containers in a dynamic format.
Configuring Zabbix Agent 2
In this section, I will describe only certain commands that need attention during integration. I will assume that the Zabbix Server is already running in the Docker environment and Zabbix Agent 2 is already installed on the host.
While monitoring your applications, don’t forget about the hardware; I recommend combining this setup with monitoring Raspberry Pi CPU temperature with Zabbix.
Access to the Docker socket
Zabbix Agent 2 accesses the Docker socket (/var/run/docker.sock), through which the Docker daemon provides information about the state and resources of all containers on the host. To grant the agent access to the Docker socket, run the following command:
sudo usermod -aG docker zabbixThis command adds the zabbix user to the docker group, allowing the agent to read the Docker socket without root privileges and securely retrieve container metrics for transmission to the Zabbix Server.
Testing the Agent’s Docker Plugin
To verify Zabbix Agent 2’s access to Docker, simply run:
zabbix_agent2 -t docker.infoThis command tests the agent’s Docker plugin locally. If the access rights to the Docker socket are correct, the command returns structured information about Docker (version, number of containers, daemon state), confirming the correct configuration of the agent and its readiness to collect metrics.
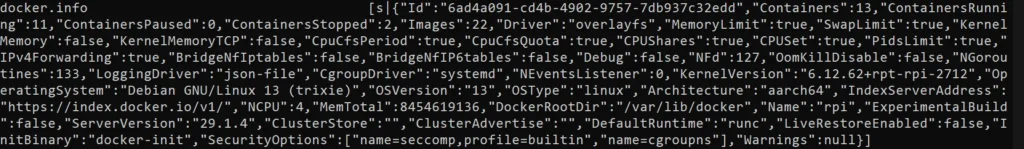
My result showed that the data exchange was successful, so we can proceed to the Zabbix configuration.
Zabbix Host Configuration
By default, a host in Zabbix is usually linked to the Linux by Zabbix agent template, which is responsible for monitoring the operating system. However, this is not enough for container monitoring, so you need to additionally link the Docker by Zabbix agent 2 template to the host. It uses the agent’s Docker plugin and allows for the collection of metrics from the Docker daemon, containers, and their statuses.
To make your new container activity graphs easier to read, ensure you’ve configured the Zabbix 24-hour time format.
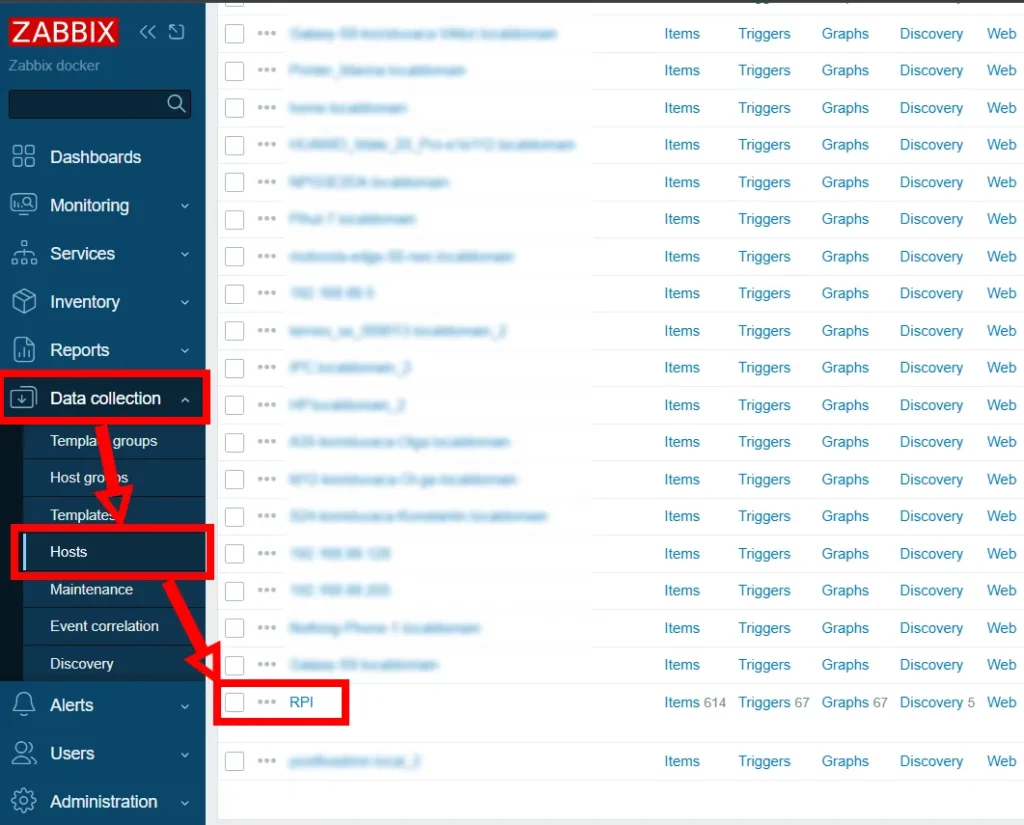
In the web interface, select the existing host (in my case, RPI):
Data collection -> Hosts -> RPI
Next, in the host settings, add the template:
Templates -> Select “Docker by Zabbix agent 2” and click “Select”.
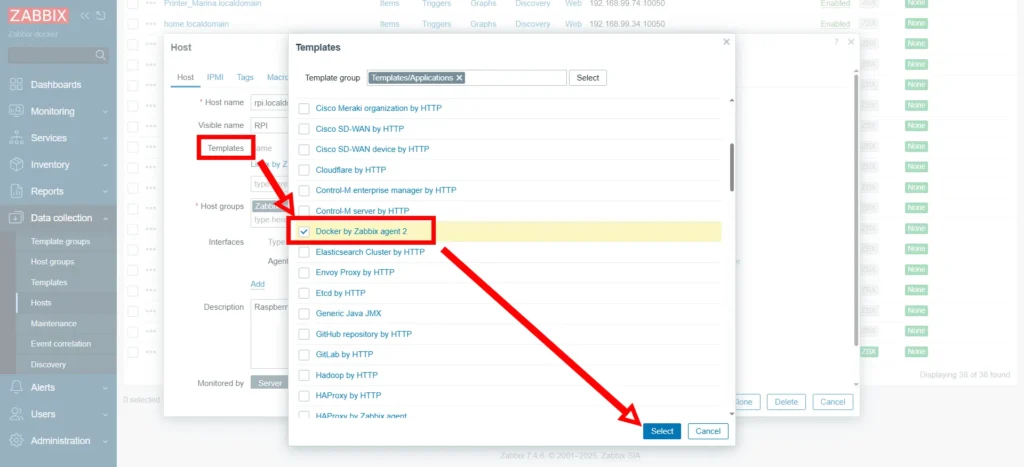
A successful result will be an increase in the number of Items. In my case, it went up to 614 records; in reality, this depends on the number of containers, as one container has 40 Items.
Data Collection
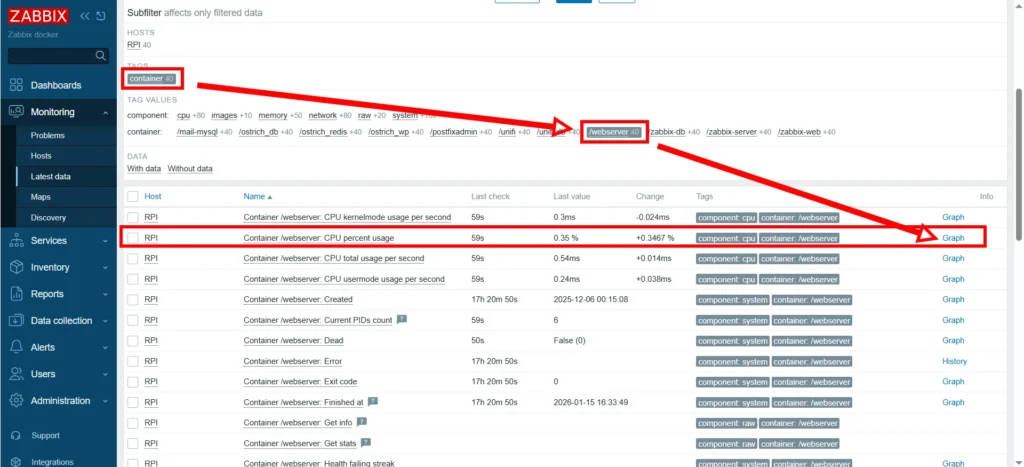
To ensure that data is being collected, go to the Monitoring -> Latest data menu and select my host (RPI) in the Hosts filter.
If the list displays TAGS and TAG VALUES corresponding to the screenshot, it means Zabbix has successfully identified the Docker containers.
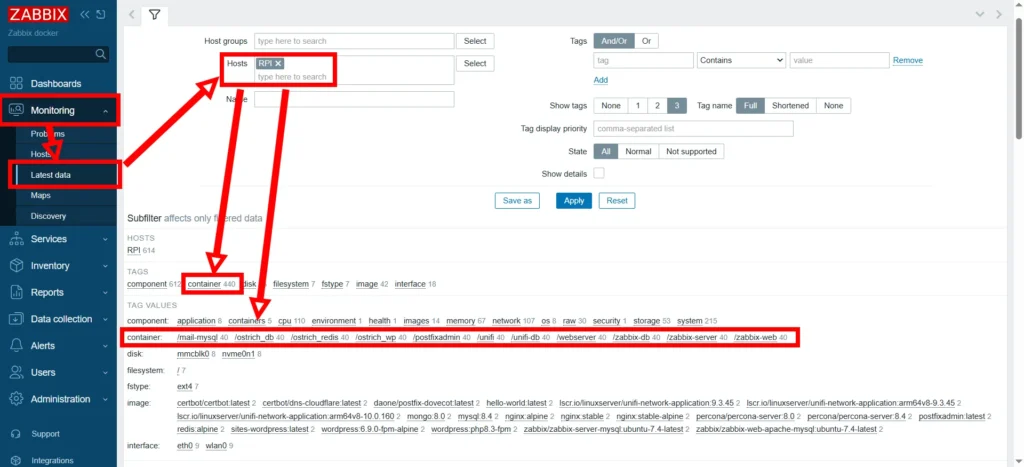
Now, by selecting any container, you can view the metrics collected. Suppose I am interested in the CPU percent usage value for the webserver container.
Using the subfilter, select TAG – container and Tag values – webserver. The list will be filtered accordingly. To view the graph, click the Graph button.
My graph for the last 3 hours looks as follows:

Based on this data, you can already build widgets on the dashboard.
If you’re just starting to containerize your services, my guide on how to migrate WordPress to Docker on a Raspberry Pi will help you build a solid foundation.
Metrics
To understand the capabilities, here are the names of all 40 metrics for Docker containers. From the names, you can logically understand which parameter each item corresponds to:
- CPU kernelmode usage per second
- CPU percent usage
- CPU total usage per second
- CPU usermode usage per second
- Created
- Current PIDs count
- Dead
- Error
- Exit code
- Finished at
- Get info
- Get stats
- Health failing streak
- Health status
- Image
- Memory commit bytes
- Memory commit peak bytes
- Memory maximum usage
- Memory private working set
- Memory usage
- Networks bytes received per second
- Networks bytes sent per second
- Networks errors received per second
- Networks errors sent per second
- Networks incoming packets dropped per second
- Networks outgoing packets dropped per second
- Networks packets received per second
- Networks packets sent per second
- Online CPUs
- OOMKilled
- Paused
- Pid
- Restart count
- Restarting
- Running
- Started at
- Status
- Throttled periods
- Throttled time
- Throttling periods
In the widget, I will apply CPU percent usage and general container data.
Widgets
To visualize the collected metrics, I will use widgets that allow for a convenient display of the current system state on the dashboard.
Specifically, the widget will be created based on Top Items rather than Top Hosts, as the interaction between the host and Docker containers in Zabbix is implemented through individual items (container metrics), not through the hosts themselves. This allows for a more accurate and clear representation of the load and status of containers.
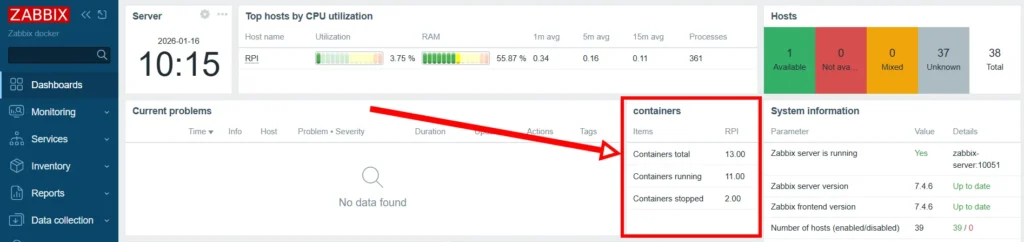
Container Count and Status
This widget is designed to visually display the number of Docker containers and their current state. It shows the total number of containers, as well as the number of running and stopped ones separately.
In the widget settings, fill in the following fields:
- Type – Top Items
- Name – Containers
- Layout – Vertical
- Items – Containers running, Containers stopped, Containers total
It looks like this:
CPU Usage
This widget is used to monitor CPU usage by individual Docker containers on the RPI host. Based on the Top Items type, it displays a list of all containers, where the * symbol in the item name indicates the automatic inclusion of every container with the CPU percent usage metric.
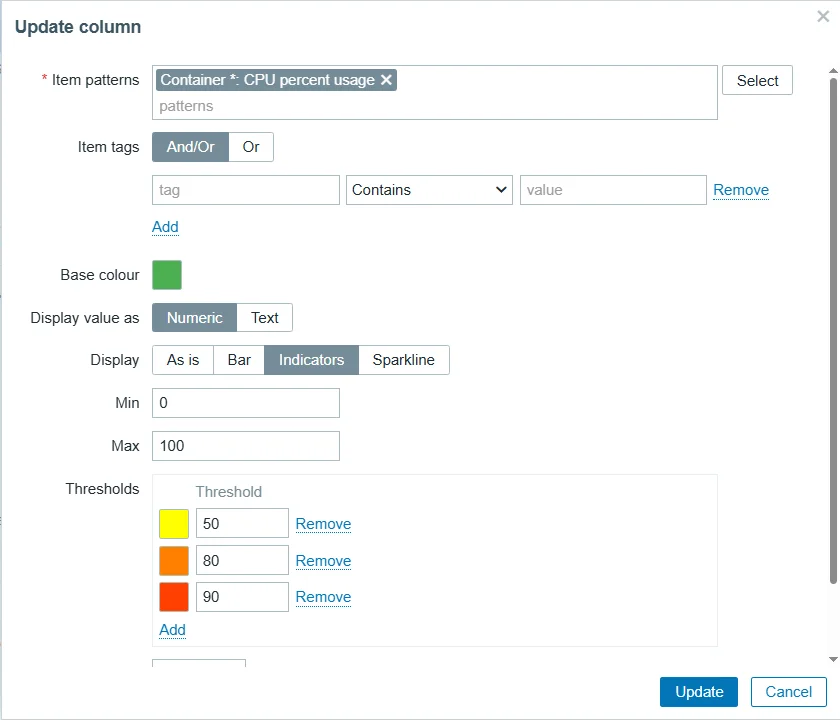
To improve visualization, in the Update column settings, the item pattern Container *: CPU percent usage is applied with a green base color and Indicators display mode (range 0 to 100%). Additionally, thresholds (50, 80, 90) are configured to change the indicator color to yellow, orange, and red, respectively.
Widget settings:
- Type – Top Items
- Name – Containers CPU usage
- Hosts – RPI
- Layout – Vertical
- Items – Container *: CPU percent usage
In the Update column window:
- Item patterns – Container *: CPU percent usage
- Base colour – зелений
- Display – Indicators
- Min / Max – від 0 до 100
- Thresholds – 50 (Yellow), 80 (Orange), 90 (Red)
This way, the widget looks quite attractive, almost like Top Hosts, except that only one column can be used in this widget.
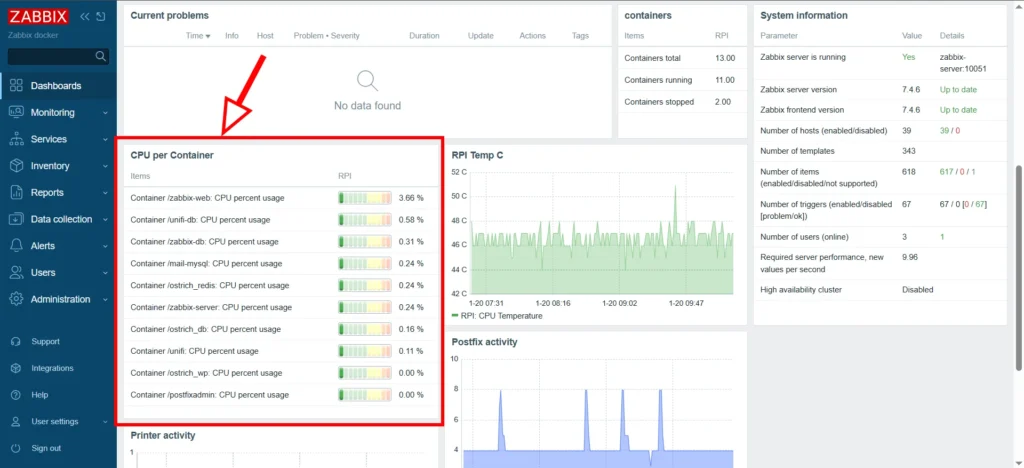
This widget displays the top 10 containers. The number can also be changed in the settings, for example, to show the 5 most loaded Docker containers by CPU resource.
Conclusions
Summing up, I can say that Zabbix has proven to be a powerful, though sometimes complex, tool for monitoring a Docker environment. Its main advantage lies in the incredible depth of analysis: with access to 40 different metrics per container, I’ve stopped guessing why a database or web server is “lagging.” The ability to see specific indicators, such as CPU Throttling or detailed network errors, provides a level of control that no standard utility can provide. The Auto-Discovery feature was particularly valuable to me – now every new service I spin up on my Raspberry Pi instantly appears on the dashboard without any manual configuration.
However, I must be honest about certain nuances. Zabbix is a professional “powerhouse” with a rather high entry barrier. Unlike simpler solutions, you can’t set everything up in two clicks; you have to dive into the logic of regular expressions, macros, and tags to make the dashboard look exactly the way you want. Also, one should consider that such powerful functionality requires resources: on older Raspberry Pi models, the server and database load might be noticeable, though my Raspberry Pi 5 handles this load quite easily.
Overall, despite the complexity of the initial setup, Zabbix provides a sense of confidence and professionalism that is hard to achieve by other methods.