
The Prometheus + Grafana bundle is a monitoring service. Prometheus collects metrics, and Grafana builds graphs. In this article, I will write how to install and configure these services on Raspberry Pi 5
Introduction
When the number of services on a home server, whether it’s a Raspberry Pi or a full-fledged node, exceeds the first dozen, managing them “blindly” becomes risky. Questions arise: how much memory is a WordPress Docker container consuming, is the processor overheating under load, and is disk space running out after the latest backup? It is precisely to keep a finger on the pulse of the system and respond to incidents in a timely manner that a professional suite of monitoring tools, which has become a standard in the IT world, is deployed.
The choice between Prometheus and Zabbix is often a subject of heated debate; however, for a modern environment based on Docker and microservices, Prometheus has significant advantages. While Zabbix is a classic “heavy” system with a vast number of settings in the database, requiring the installation of agents and often redundant configuration for each new host, Prometheus fits perfectly into the “infrastructure as code” concept. It is lighter, faster, and operates on a pull model, independently collecting data from containers, which makes its scaling on a Raspberry Pi significantly more efficient. Moreover, the Prometheus ecosystem offers the flexible PromQL query language, which allows for the creation of complex analytical graphs in seconds, whereas in Zabbix, similar visualization often requires cumbersome manual work.
Prometheus and Grafana Configuration
To start, it is necessary to define a name and create a home directory. In my case, it will be called Monitoring.
mkdir MonitoringThere will be two files in this directory, the contents of which I will describe in more detail:
The first file is the main docker-compose.yml – I will describe three main components in it:
- Prometheus: data collection service.
- Grafana: a visualization dashboard.
- Node Exporter: an agent that collects metrics specifically from the Raspberry Pi “hardware” (CPU, RAM, disk).
The configuration will be as follows:
services:
  prometheus:
    image: prom/prometheus:latest
    container_name: prometheus
    volumes:
      - ./prometheus.yml:/etc/prometheus/prometheus.yml
    ports:
      - 9090:9090
    restart: unless-stopped

  grafana:
    image: grafana/grafana:latest
    container_name: grafana
    ports:
      - 3100:3000
    environment:
      - GF_SECURITY_ADMIN_PASSWORD=<strong password>
    restart: unless-stopped

  node-exporter:
    image: prom/node-exporter:latest
    container_name: node-exporter
    ports:
      - 9100:9100
    restart: unless-stopped
In this configuration, basic parameters for creating Docker containers are used:
- image: the name and link to the corresponding Docker container.
- container_name: the name of the local Docker container.
- ports: the ports that will be listened to.
- restart: always bring the container up after a Raspberry Pi reboot.
Since I have the WUD service running on port 3000, that port is occupied; therefore, I replaced the standard Grafana port from 3000 to 3100.
The second file — prometheus.yml — is specifically the configuration for Grafana settings:
global:
  scrape_interval: 15s

scrape_configs:
  - job_name: 'node'
    static_configs:
      - targets: ['node-exporter:9100']
global section: This is where parameters related to the entire monitoring process are set. The scrape_interval: 15s parameter tells Prometheus how often it should “visit” services for new data. A value of 15 seconds is the optimal balance for the Raspberry Pi 5: it is frequent enough to see actual load spikes but does not overload the processor with constant requests.
scrape_configs section: This is a list of sources from which we collect information. Each source is described as a separate “job.”
job_name: ‘node’: This is the name of the job, which will later be used to filter data in Grafana. We named it ‘node’ because it is responsible for monitoring the physical node of the host.
static_configs and targets: Here we specify the exact address where the metrics are located. Since we are using Docker Compose, instead of a complex IP address, we simply write the service name node-exporter:9100.
Such an architecture allows for easy scaling of monitoring: if tomorrow you want to add monitoring for your WordPress or Nginx, you just need to add a new block to scrape_configs with the corresponding exporter port.
After defining the configurations, you can launch the services and look at the result.
Launching Prometheus
By executing the basic service launch command:
docker compose up -d
[+] up 29/29
 ✔ Image grafana/grafana:latest    Pulled
 ✔ Image prom/prometheus:latest    Pulled
 ✔ Image prom/node-exporter:latest Pulled
 ✔ Network monitoring_default      Created
 ✔ Container prometheus            Created
 ✔ Container grafana               Created
 ✔ Container node-exporter         Created
you can go to a web browser at the address:
http://<IP>:9090and see the Prometheus home page on the Query tab.
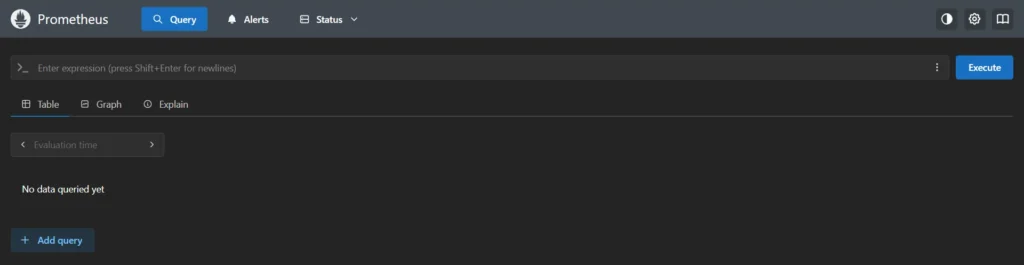
The Prometheus interface may seem ascetic, but it is not intended for daily monitoring. Its main task in the web interface is to provide the ability to quickly test a query or check the status of connected sources (Target health).
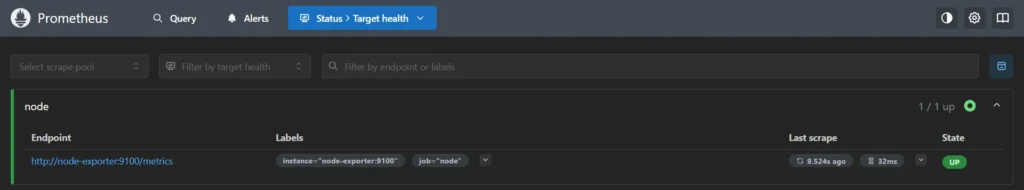
If the status of the targets is ‘UP‘, it means the system is working properly, and you can move on to the most interesting part — graphs in Grafana.
Launching Grafana
Since all containers specified in the configuration were brought up at once when the file was executed, it is enough to visit the page in the browser at the address:
http://<IP>:3100
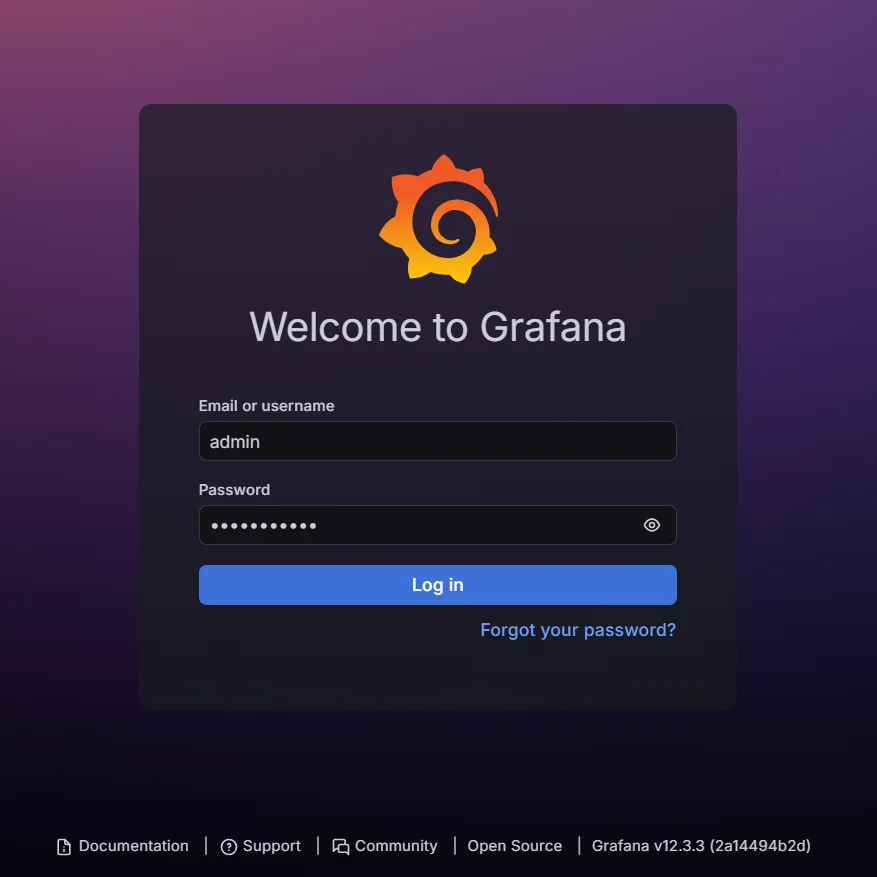
A beautiful authorization page will open where you need to enter the basic login admin and the password specified in the configuration, specifically in the GF_SECURITY_ADMIN_PASSWORD variable.
Connecting the Database to Grafana
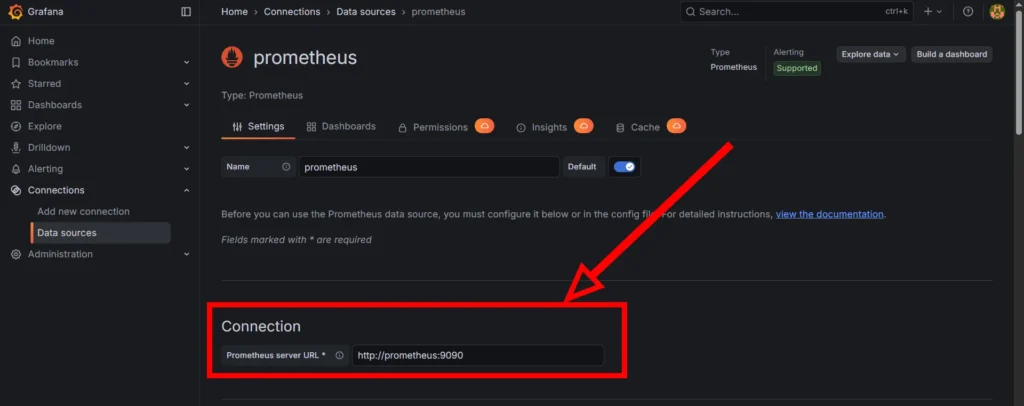
To visualize data, it is necessary to add Prometheus as a Data Source in the Grafana settings, specifying the internal address of the container http://prometheus:9090. After a successful connection test, Grafana will gain access to all metrics, allowing you to build graphs and set up professional dashboards for monitoring your Raspberry Pi.
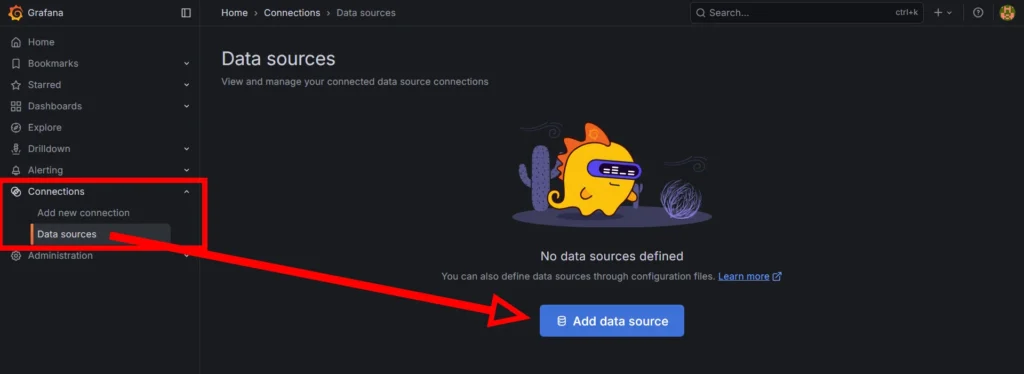
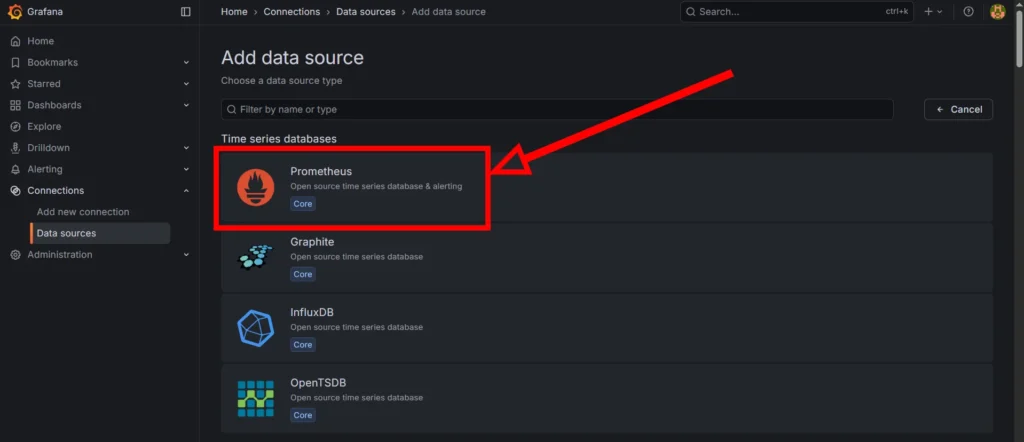
In Grafana, you must select the menu Connections -> Data Sources. Click Add data source. A large selection of sources will appear in the list; the very first one will be Prometheus, which should be selected.
Among several settings, in the Connection section, in the Prometheus server URL field, enter http://prometheus:9090 (since they are in the same Docker network).
After clicking the Save & Test button, a message will appear:
Successfully queried the Prometheus API. Next, you can start to visualize data by building a dashboard, or by querying data in the Explore view.
This indicates a correct setup and proper information exchange.
Creating Graphs (Dashboard)
Grafana allows you to import ready-made professional dashboards using unique IDs, such as the popular preset 1860 for Node Exporter. After importing, you will get an interactive control panel that displays the load on the Raspberry Pi 5 cores, processor temperature, and memory status in real-time in the form of clear graphs and indicators. This turns the mass of raw data from Prometheus into a powerful tool for visual analysis and quick diagnosis of your infrastructure’s status.
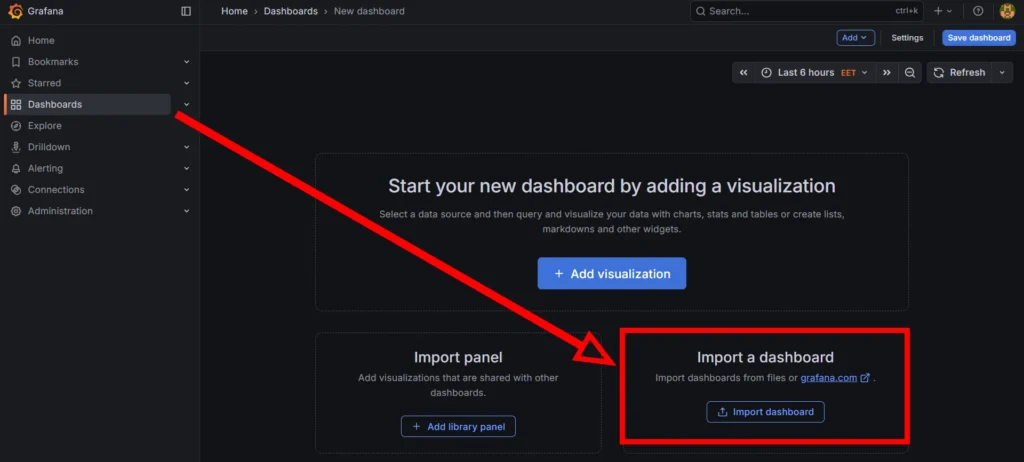
In the menu, you need to navigate in the following sequence: Dashboards -> Create Dashboard -> New -> Import.
One of Grafana’s greatest advantages is the huge community that shares ready-made solutions on the official Grafana Dashboards portal. Each such template has its own unique identifier (ID).
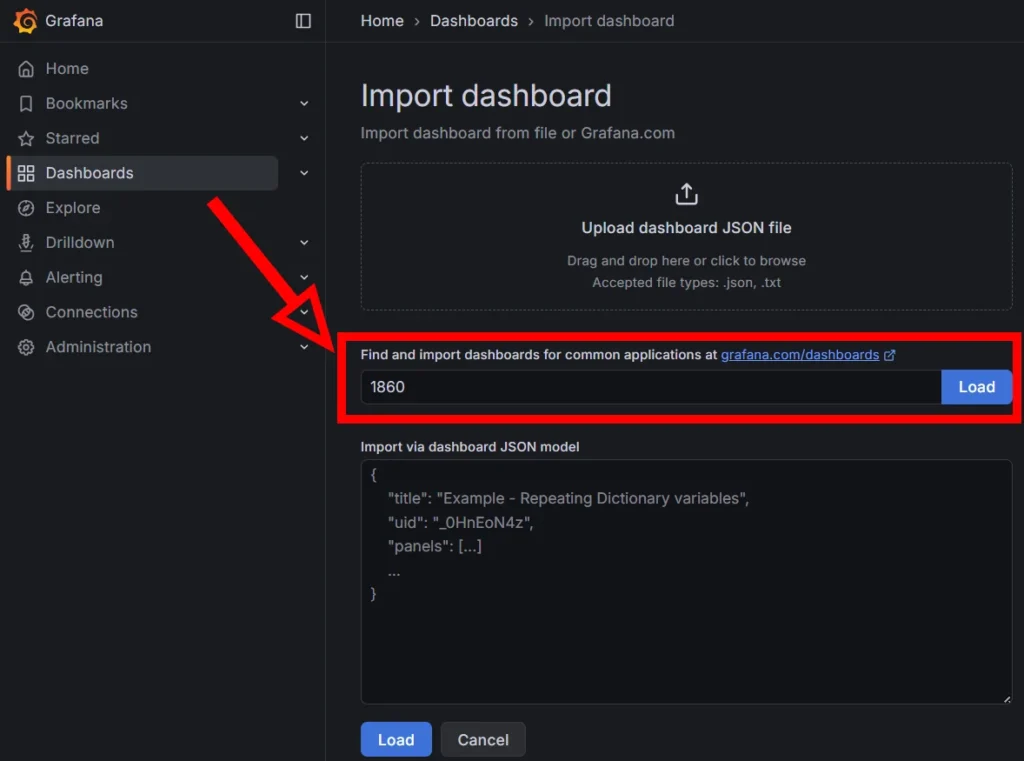
The number 1860 belongs to the world’s most popular dashboard, “Node Exporter Full,” which was created for the complete visualization of system-level metrics.
In the Import dashboard field, enter this ID and click the Load button. The template will automatically download and be ready for use.
Information about this dashboard will be displayed on the page; to start the import, click the Import button. The collected data will gradually begin to appear on the graphs.
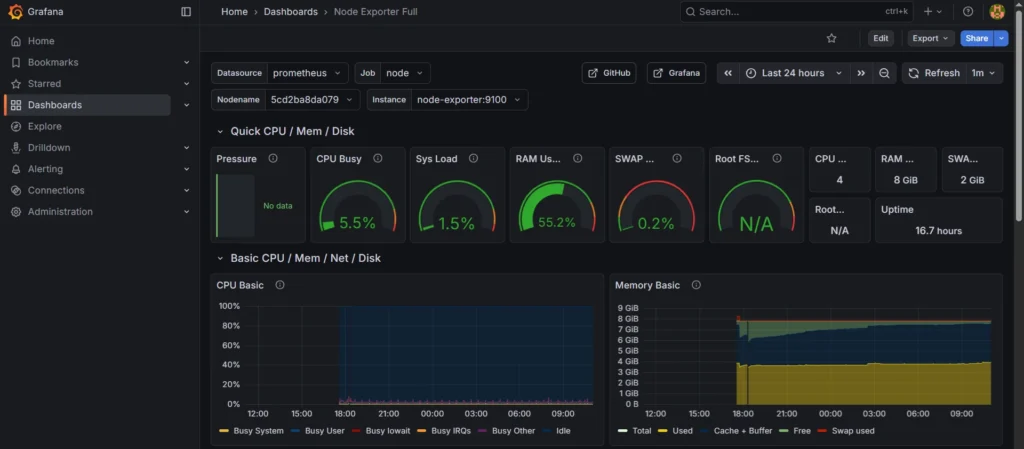
In my case, 24 hours have not yet passed, so the graphs are not yet completely filled to the limit, but changes over time are visually apparent.
Conclusions
In this article, I reviewed the basic process of deploying and linking Prometheus and Grafana in a Docker environment on a Raspberry Pi 5. This setup allowed me not just to run the services, but to integrate them into a unified monitoring system, turning raw hardware performance data into clear and aesthetic graphs. I have seen that the modern monitoring stack is significantly more flexible than classic solutions, providing high-speed real-time analysis of the server’s state.
However, installing Node Exporter is only the first step, covering system-level metrics such as CPU load or memory usage. The monitoring ecosystem offers a vast number of other exporters that allow you to dive into the details of each service: from analyzing traffic and errors in Nginx to monitoring queries in MariaDB databases or tracking container updates via WUD. In future materials, I will continue to expand the system by adding new data sources and setting up smart alerts for critical events.