Monitoring disk space in Grafana is a key task for any self-hosted setup, but running Node Exporter in Docker often leads to missing drives. In this guide, I’ll show you how to fix mount points for Root FS and MicroSD cards to get accurate storage metrics.
Checking the mount point of the drives
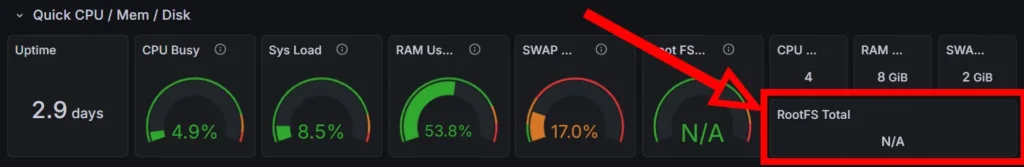
Currently, the Root FS and MicroSD cards are not showing up in the dashboard. In this article, I will fix it step by step!
The list of real disks and mount points looks like this:
lsblk
NAME        MAJ:MIN RM   SIZE RO TYPE MOUNTPOINTS
loop0         7:0    0     2G  0 loop
mmcblk0     179:0    0 117.1G  0 disk
└─mmcblk0p1 179:1    0 117.1G  0 part /media/rpi/NX
zram0       254:0    0     2G  0 disk [SWAP]
nvme0n1     259:0    0 238.5G  0 disk
├─nvme0n1p1 259:1    0   512M  0 part /boot/firmware
└─nvme0n1p2 259:2    0   238G  0 part /
That is, I only have 2 disks:
- nvme0n1 256 GB – my SSD on which the system is installed
- mmcblk0 128 GB – my MicroSD card for video surveillance
Now we need to determine how Prometheus and Grafana see these disks
If you haven’t set up your environment yet, start with my guide on installing Prometheus and Grafana on Raspberry Pi 5.
Disks and Mount Points Available to Prometheus
The first step in setting up Raspberry Pi monitoring is to check which drives and mount points Prometheus sees. Using the node_filesystem_size_bytes query, we expect to see a full list of physical devices, such as the system SSD (/dev/nvme0n1) or the MicroSD card (/dev/mmcblk0). This data is the foundation for visualization in the Node Exporter Full dashboard, where variables filter metrics by device name or its connection point in the system.
However, unfortunately, when executing the node_filesystem_size_bytes query, I get an unexpected response that indicates that the mountpoint is not to the disk, but to specific files.
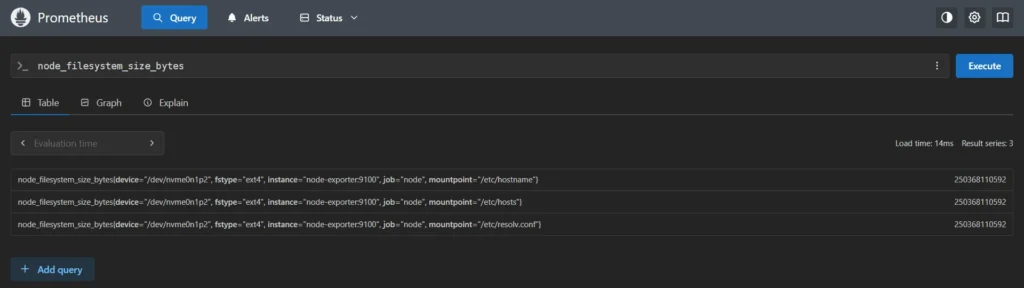
Instead of actual disk partitions, Prometheus only outputs three specific mount points:
/etc/hostname/etc/hosts/etc/resolv.conf
This problem occurs due to the isolation of the container, when the Node Exporter is running in Docker without proper access to the host system.
In this state, the exporter sees only those virtual files that Docker automatically throws inside each container for network operation, ignoring SSDs and other storage devices.
Fixing Node Exporter Configuration
To fix this and get access to real hardware metrics, you need to change the container startup configuration. The basic solution is to mount the entire root filesystem of the Raspberry Pi into the container (usually in the /host directory) and use the --path.rootfs flag.
This allows Node Exporter to go beyond the Docker sandbox and collect correct data about disk usage, temperature, and file system health directly from your OS.
Changes for Root FS
Add the following lines to the configuration file, in the Node Exporter block:
volumes:
- /:/host:ro,rslave
command:
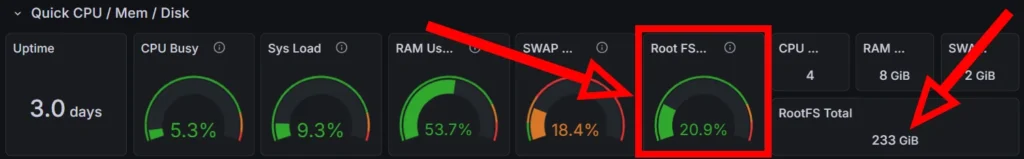
- '--path.rootfs=/host'After the container restarts, the Root FS value will appear on the dashboard.
Changes for MicroSD
However, this is not enough, as you still need to add a MicroSD memory card. My card acts as a storage disk for data from the CCTV camera, so it has mounting restrictions:
cat /etc/fstab
/dev/disk/by-id/mmc-USDU1_0x023b122a-part1 /media/rpi/NX/ auto nosuid,nodev,nofail,x-gvfs-show 0 0
It is because of the nodev attribute that Docker cannot access this disk, which is why it writes an error in Prometheus:
node_filesystem_device_error{device="/dev/mmcblk0p1", device_error="permission denied", fstype="ext4", instance="node-exporter:9100", job="node", mountpoint="/media/rpi/NX"} 1To correct the access rights for the Docker container, you need to add another parameter to the configuration file:
user: "1000:1000"Now the container will be run as the system user. In any case, this is better than running the container as root:root.
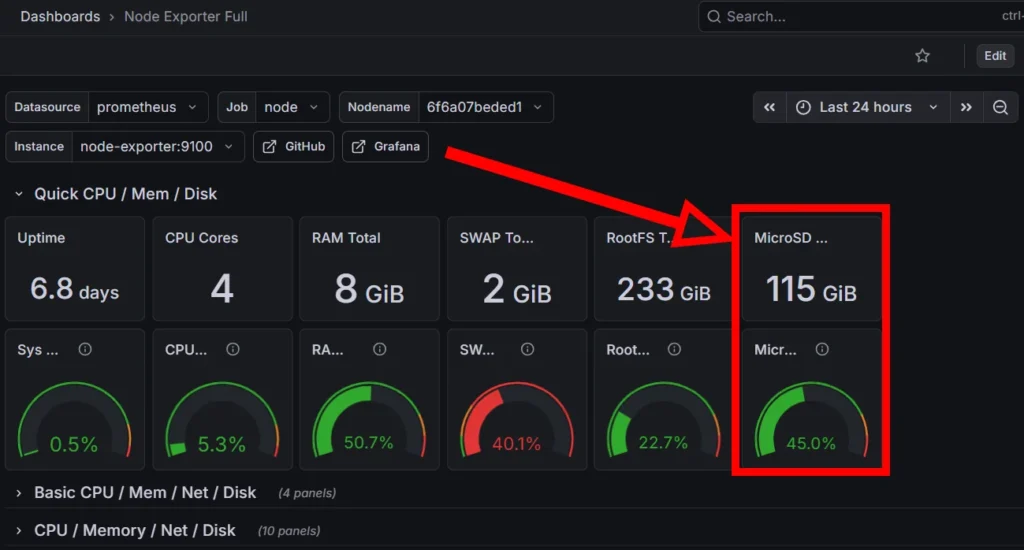
node_filesystem_size_bytes{device="/dev/mmcblk0p1", fstype="ext4", instance="node-exporter:9100", job="node", mountpoint="/media/rpi/NX"} 123181195264Based on the neighboring Root FS widget, I made a duplicate and replaced the mount point from / to /media/rpi/NX, thus obtaining a separate graph for my card.
Now all that remains is to remove the extra mounted files, so you need to add a line that will exclude the following directories:
- '--collector.filesystem.mount-points-exclude=^/(dev|proc|sys|run|tmp|host)($|/)'For those who prefer a different stack, you can also compare this to monitoring Docker container activity in Zabbix.
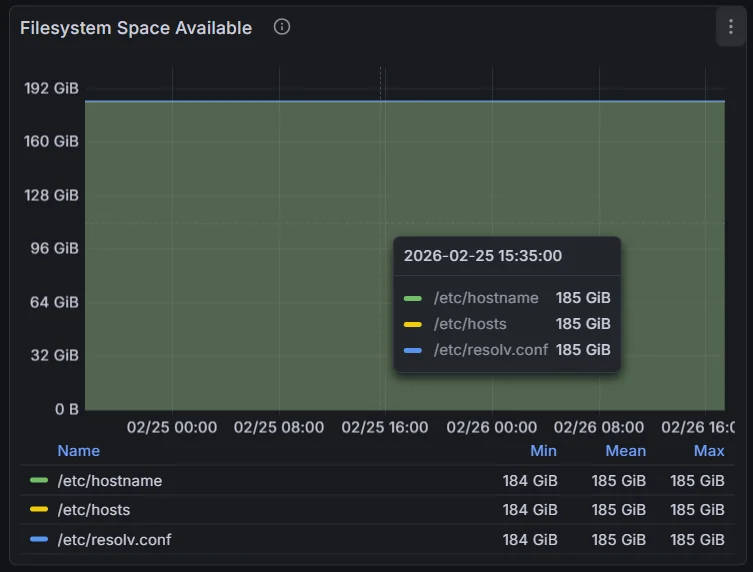
Result
After making the changes, access to the file system and memory card was restored, files and directories were hidden. The resulting complete node-exporter configuration block looks like this:
node-exporter:
    image: prom/node-exporter:latest
    container_name: node-exporter
    user: "1000:1000"
    volumes:
      - /:/host:ro,rslave
    command:
      - '--path.rootfs=/host'
      - '--collector.filesystem.mount-points-exclude=^/(dev|proc|sys|run|tmp|host)($|/)'
    ports:
      - 9100:9100
    restart: unless-stopped
Conclusions
So, for displaying the main file system (Root FS), the main obstacle was the basic isolation of the Docker container, due to which the exporter could only see the system network files. I successfully solved this by completely mounting the root directory of the Raspberry Pi inside the container and specifying the correct path to the Node Exporter via the –path.rootfs flag. Additional use of regular expressions to exclude service directories (dev, proc, sys, etc.) allowed us to get rid of information noise and display clean statistics of our system NVMe SSD on the dashboard.
As for the MicroSD card for video surveillance, the problem was the strict restrictions on access rights set by the mount parameters in /etc/fstab. Instead of compromising on security and running the container with root privileges, we applied the best practice – we delegated the rights of a regular system user to the container via the user: “1000:1000” parameter. This elegant solution instantly fixed the “permission denied” error, allowing Prometheus to collect metrics and for us to easily output them to a separate widget in Grafana.
Since I’m monitoring my Samsung NVMe SSD for Raspberry Pi 5, getting the Root FS right was the top priority.